
In the bustling world of Telegram, a large member count can be deceiving. True community health isn't just about subscriber numbers; it's about active participation, genuine connection, and sustained value. For creators looking to build a thriving, monetised community, understanding the right community engagement metrics is paramount. These aren't just abstract data points; they are the vital signs of your community, revealing what's working, what isn't, and where your greatest opportunities lie.
This guide moves beyond vanity metrics to explore the eight most critical indicators of success for Telegram channels and groups. We will provide actionable steps to track, analyse, and ultimately cultivate a more interactive and loyal audience. By focusing on these specific measurements, you can make informed decisions that directly impact member satisfaction and long-term growth. To gain a broader perspective on how platforms cultivate their user base, exploring Formbricks' community page can offer valuable insights into building an active following from the ground up.
Throughout this listicle, we'll break down each metric with clear definitions, practical benchmarks, and tips for implementation, ensuring you have the tools needed to transform raw data into a powerful strategy for community-led success.
1. Engagement Rate
Engagement Rate is the foundational metric for understanding how actively your members interact with your content. It calculates the percentage of your community that engages with your posts through reactions, comments, or poll votes within a given period. This metric provides a vital health check, moving beyond simple member counts to measure genuine, active participation.
For Telegram communities, the formula is straightforward:
(Total Engagements [Reactions + Comments] on a post) / (Total Members in the group/channel) x 100 = Engagement Rate %
Tracking this is crucial because a high member count means little if nobody is paying attention. A strong engagement rate indicates that your content is valuable, relevant, and resonates with your audience, which is a key goal for any community-focused creator.
How to Track and Improve Your Engagement Rate
Consistently measuring this metric is one of the most important community engagement metrics you can monitor. Instead of fixating on the performance of a single post, focus on the average rate over weeks or months to identify meaningful trends.
- Establish a Baseline: Track your average engagement rate for a month to understand your current performance. This becomes the benchmark you aim to improve upon.
- Analyse Top-Performing Content: Identify which posts (e.g., questions, polls, long-form insights, behind-the-scenes videos) generate the most reactions and comments. Double down on these successful formats.
- Focus on Quality over Quantity: A single thoughtful comment can be more valuable than ten simple reactions. Encourage deeper conversations by asking open-ended questions that prompt detailed responses from your members.
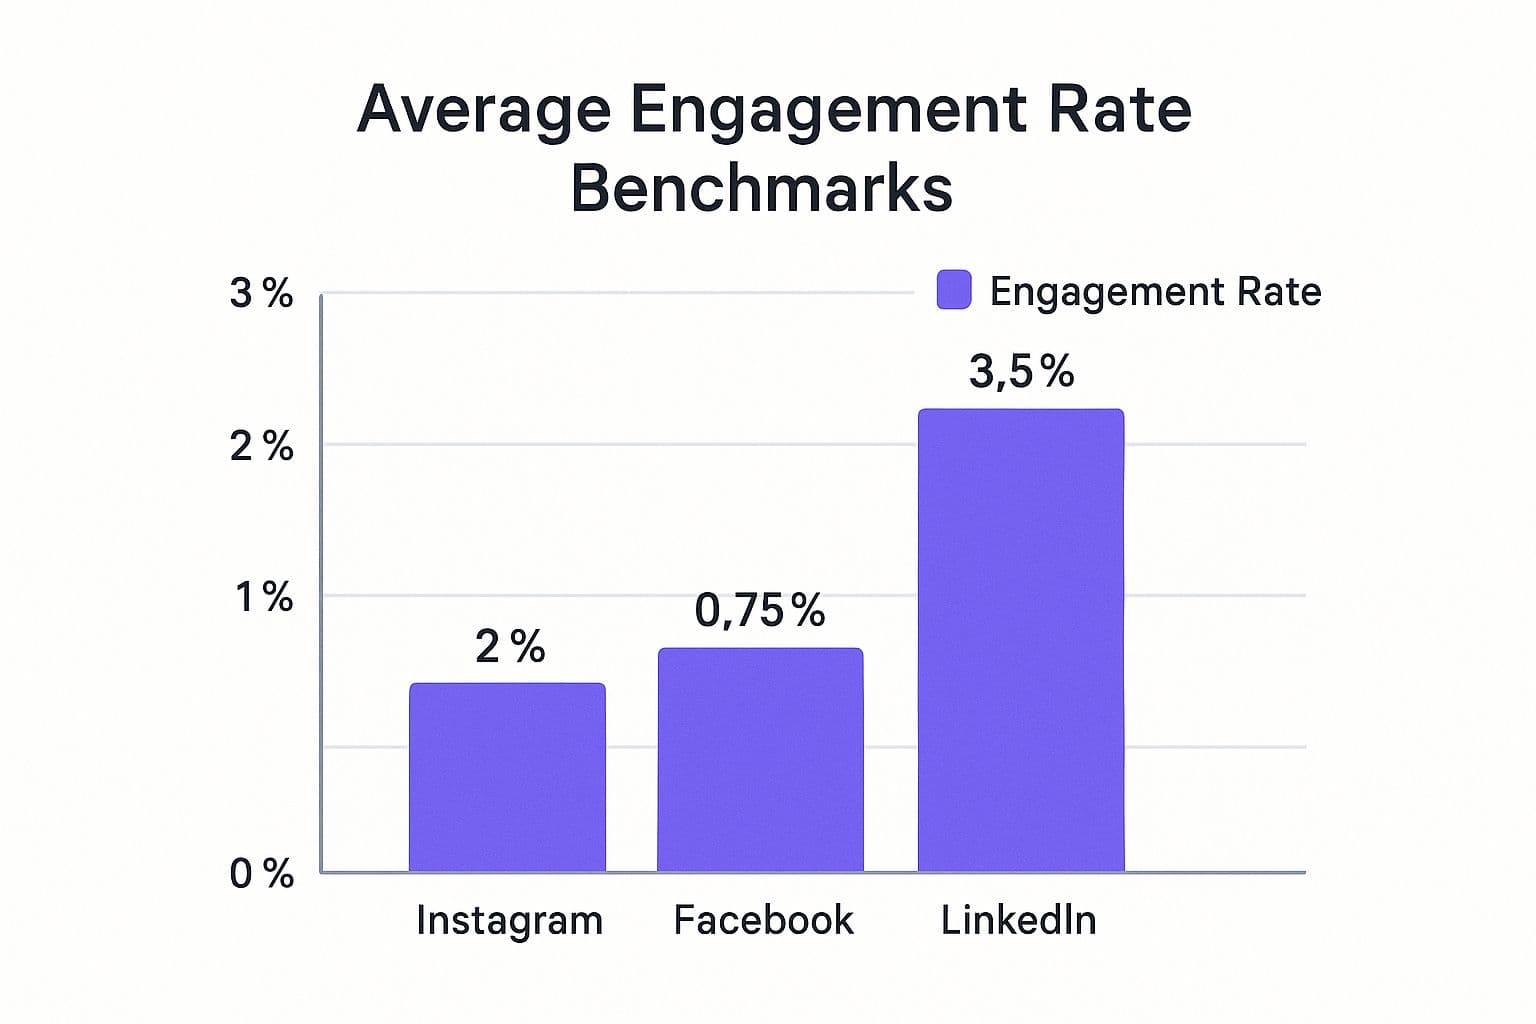
The following bar chart visualises typical engagement rate benchmarks for social platforms, offering a useful comparison for setting your own targets.
infographic-10a8a3b9-d12d-4766-aaaa-2a4f6d0a5d04.jpg
As the chart illustrates, what's considered a "good" engagement rate can vary significantly between platforms, highlighting the importance of context when evaluating your own community's performance.
2. Community Growth Rate
Community Growth Rate tracks the speed at which your community is expanding over a specific time period. It measures the net increase in members, offering a clear view of your community’s appeal and the effectiveness of your acquisition efforts. This metric is essential for understanding momentum and forecasting future size, moving beyond a static member count to reveal the velocity of your growth.
For Telegram communities, the calculation helps you quantify your expansion:
([Members at End of Period - Members at Start of Period] / Members at Start of Period) x 100 = Growth Rate %
Tracking this is a vital part of monitoring community engagement metrics because sustainable growth indicates a healthy, thriving ecosystem. It shows that your value proposition is strong enough to consistently attract new people, which is fundamental for long-term success and influence.
How to Track and Improve Your Community Growth Rate
A consistent approach to monitoring growth provides the insights needed to refine your strategies. Instead of just celebrating new member milestones, analyse the rate of growth to understand what drives acquisition and retention.
- Set Realistic Targets: Your growth goals should reflect your community's maturity. A new community might target 15-20% monthly growth during a launch campaign, while an established one may aim for a steady 5% quarterly growth.
- Track Net vs. Gross Growth: Monitor both the number of new joins (gross growth) and the final member count after accounting for those who leave (net growth). A large gap between the two can signal issues with member onboarding or community value.
- Analyse Your Sources: Identify where your new members are coming from. Is it a specific social media campaign, a collaboration, or organic discovery? Double down on the channels that deliver the most engaged members, not just the highest volume. To explore this further, you can learn more about effective membership growth strategies on mymembers.io.
3. Response Time and Rate
Response Time and Rate is a dual metric that measures both how quickly your team addresses member questions and the percentage of those questions that receive a response. For communities built on trust and support, such as those on Telegram, these are critical community engagement metrics. A swift, reliable response system shows members they are valued and heard, directly impacting satisfaction and retention.

7b2704ff-dec3-4a0b-a64e-b036f29df240.jpg
This metric is especially important in service-oriented communities, like those for online courses or subscription services, where timely support is part of the value proposition. For example, a customer support community might target a 24-hour response time, whereas a highly active group like Zapier’s community aims for a much faster average.
Response Time: Average time taken to reply to a member's initial post or question.
Response Rate: (Total number of member questions answered / Total number of member questions asked) x 100 = Response Rate %
Tracking this demonstrates your commitment to member support. A high response rate combined with a low response time signals a healthy, attentive, and well-managed community, fostering a safe environment where members feel confident asking for help.
How to Track and Improve Your Response Time and Rate
Monitoring your responsiveness helps you allocate resources effectively and set clear member expectations. A poor response rate can quickly lead to member churn, as unanswered questions create frustration and a sense of being ignored.
- Set Clear Expectations: Communicate your target response times to members. A simple pinned message in your Telegram group like, “Our team aims to respond to all questions within 12 hours,” can manage expectations effectively.
- Use Automation for Acknowledgement: Implement a simple bot to acknowledge new questions instantly. This reassures the member that their query is in the queue while your team prepares a more detailed, human response.
- Establish Escalation Paths: Create a clear process for handling complex or sensitive questions that moderators cannot answer alone. This ensures no query gets lost and that experts are brought in when needed.
- Train Your Moderator Team: Equip your moderators with templates for common questions and guidelines on tone and efficiency. A well-organised team is fundamental to improving these community engagement metrics.
4. Active Member Ratio
Active Member Ratio measures the percentage of your community that actively participates within a specific timeframe, such as the last 30 days. This metric moves beyond vanity counts, helping you distinguish between genuinely involved members and passive subscribers who may no longer be paying attention.
This powerful metric reveals the true health and stickiness of your community. It is calculated by identifying unique members who have performed at least one meaningful action.
(Number of Unique Active Members in a Period) / (Total Community Members) x 100 = Active Member Ratio %
Tracking this is essential among community engagement metrics because it answers a critical question: is your community a thriving hub or just a large, silent audience? A high ratio indicates that you have successfully built a space where members feel compelled to return and contribute regularly. For example, well-managed professional forums can achieve a 20-30% monthly active ratio, a strong benchmark for targeted communities.
How to Track and Improve Your Active Member Ratio
Improving this ratio requires a multi-faceted approach focused on value, recognition, and strategic re-engagement. The goal is to create an environment so valuable that members make visiting a habit.
- Define 'Active' Clearly: Your first step is to decide what an “active member” is for your community. This could be someone who sends a message, reacts to a post, or votes in a poll. A clear definition ensures consistent tracking.
- Create Multiple Engagement Paths: Cater to different personalities. Some members are lurkers who prefer polls, while others are conversationalists who love open discussions. Providing varied ways to participate, from simple reactions to detailed Q&As, broadens your active base.
- Re-engage Inactive Members: Segment your audience and create targeted campaigns to bring dormant members back. A weekly summary or a special mention might be all it takes to reactivate their interest. Using Telegram for business tools can help you organise these outreach efforts effectively.
- Recognise and Celebrate Activity: Publicly acknowledge your most active members. A simple “Top Contributor of the Week” shout-out can create a powerful incentive for others to participate more, fostering a virtuous cycle of engagement.
5. User-Generated Content (UGC) Volume
User-Generated Content (UGC) Volume measures the amount of content created by community members themselves, rather than by you or your team. This includes everything from original text posts and detailed comments to photos, videos, and project shares. It's a powerful indicator of a mature and highly-invested community, signalling that members feel a deep sense of ownership and are actively contributing to its value.

ad982801-92c4-49f9-a19a-56cb8df88c72.jpg
Unlike simple reactions, UGC represents a significant investment of time and effort from your members. For a Telegram group, you can track this by counting the number of member-initiated posts, media uploads, or substantial, value-adding comments over a set period.
A high UGC volume is the ultimate sign of a self-sustaining community. It reduces the content creation burden on you and transforms your space from a broadcast channel into a collaborative ecosystem.
When members are creating the content, it confirms they see the community as their space. This is a crucial step in building long-term loyalty and one of the most advanced community engagement metrics you can aspire to influence. For instance, some dedicated Reddit communities see over 90% of all posts come directly from users, creating a vibrant, self-perpetuating environment.
How to Track and Boost Your UGC Volume
Tracking UGC requires a more manual, qualitative approach than other metrics, but the insights are invaluable. The goal is to encourage a culture where members feel empowered and motivated to contribute.
- Set Up Contribution Channels: Create specific prompts, challenges, or dedicated threads where users are encouraged to share. For a fitness community, this could be a weekly "progress picture" thread. For a coaching group, it could be a "wins of the week" post.
- Establish Recognition Programmes: Actively celebrate top contributors. You can feature the "Post of the Week," give special roles or badges to highly active members, or simply offer public praise. Recognition is a powerful, non-monetary incentive.
- Provide Clear Guidelines and Templates: Reduce the barrier to entry by telling members exactly what kind of content you're looking for. A simple template for a project showcase or a book review can make it much easier for someone to post for the first time.
- Showcase and Amplify Great UGC: When a member shares something amazing, make a big deal out of it. Pin their post, share it across other platforms (with permission), and highlight why it’s a great example of a community contribution. This shows others what's valued and encourages them to participate.
The following video explains the core value of UGC and how it builds authentic connections with an audience, a key goal for any community builder.

embed
By systematically encouraging and celebrating member contributions, you can foster a community that not only consumes content but actively co-creates it, leading to unparalleled levels of engagement and value.
6. Member Retention Rate
Member Retention Rate is the percentage of community members who remain in your group over a specific period. This metric is fundamental to long-term success, as it measures your community's "stickiness" and your ability to deliver sustained value. High retention is often more important than rapid member acquisition, as it signals a healthy, valuable, and sustainable community.
For a Telegram community, the calculation is focused on keeping members in the group:
(([Total Members at End of Period] - [New Members Joined During Period]) / [Total Members at Start of Period]) x 100 = Member Retention Rate %
Tracking this is one of the most critical community engagement metrics for sustainable growth. A low retention rate, or high churn, can indicate that your community isn't meeting expectations, your content has become stale, or the initial promise of joining isn't being fulfilled. Conversely, a high rate proves you are consistently delivering value that keeps people engaged and invested.
How to Track and Improve Your Member Retention Rate
Analysing why members stay is just as important as understanding why they leave. By focusing on retention, you build a stable foundation that makes future growth more meaningful and less reliant on a constant influx of new people.
- Track Retention Cohorts: Instead of looking at the overall member count, group members by their join date (e.g., all members who joined in January). Tracking the retention of these specific cohorts over time gives you a much clearer picture of how your onboarding and long-term engagement strategies are performing.
- Implement a Strong Onboarding Programme: The first few days in a community are critical. Create a welcome sequence, a pinned message with essential rules and resources, and an initial interactive post to make new members feel seen and integrated from the start. This significantly improves early retention.
- Create Progression and Recognition: Give long-term members a reason to stay. Implement roles, badges, or special access for veteran members to recognise their loyalty and contribution. This creates a sense of belonging and status within the community.
- Survey Departing Members: While Telegram doesn't notify you when someone leaves, you can periodically invite members to a feedback survey. Understanding the common reasons for churn, whether it's content relevance or notification fatigue, provides direct insights for improvement. For paid communities, this data is invaluable for optimising your value proposition. Exploring different value propositions can be a good starting point; you can learn more about how different subscription pricing examples align with member value.
7. Sentiment Analysis Score
Sentiment Analysis Score moves beyond what members are saying to understand how they feel. It evaluates the emotional tone of community conversations, categorising messages as positive, negative, or neutral. This qualitative metric is essential for gauging community health, member satisfaction, and overall brand perception.
Understanding the collective mood of your community helps you proactively manage its well-being. A positive sentiment score indicates a happy, supportive environment, while a negative score can be an early warning sign of brewing issues or dissatisfaction.
A community's emotional tone directly impacts its longevity and member retention. A consistently negative atmosphere can drive away even the most loyal members, making sentiment one of the most critical community engagement metrics to monitor.
For example, a gaming company could track player sentiment in its Telegram group after a major game update to quickly identify and address frustrating bugs. Similarly, a fitness coach could monitor sentiment to see how members feel about a new workout programme, allowing for timely adjustments. For a deeper understanding of this metric, you can further explore the concept of Sentiment Analysis.
How to Track and Improve Your Sentiment Score
Monitoring the emotional pulse of your community requires a combination of technology and human insight. The goal is not just to measure the score but to understand the "why" behind it and take meaningful action.
- Establish a Baseline: Use an AI-powered community tool or manual sampling to determine your average sentiment score over a month. This benchmark will help you spot significant shifts in community mood.
- Segment by Topic: Analyse sentiment in different contexts. Are conversations about new content positive while discussions about community rules are negative? Segmenting helps you pinpoint specific areas for improvement.
- Address Negativity Proactively: When you notice a spike in negative sentiment, don’t ignore it. Intervene quickly, acknowledge member concerns, and communicate the steps you are taking to address the issue. This shows members you are listening and care.
- Amplify Positivity: Identify the topics and activities that generate the most positive sentiment. Acknowledge and encourage these conversations to reinforce a healthy and supportive community culture.
8. Event Participation Rate
Event Participation Rate measures the percentage of your community members who attend your events, whether they are virtual webinars, Q&A sessions, or in-person meetups. This metric is a powerful indicator of your community's health, as it demonstrates members' willingness to dedicate their time to a shared, live experience, signalling strong community bonds and high perceived value in your offerings.
For a Telegram community event, the formula is:
(Total Unique Attendees at an event) / (Total Community Members) x 100 = Event Participation Rate %
Tracking this is essential because events are often a significant investment of time and resources. A high participation rate validates that effort and shows your community is not just a passive audience but an active, connected group. It's one of the most revealing community engagement metrics for gauging deep-level commitment.
How to Track and Improve Your Event Participation Rate
A low turnout doesn't always mean a lack of interest; it could be a signal to adjust your event strategy. Consistently tracking participation helps you understand what truly mobilises your members.
- Survey Your Members: Before planning, ask your community about preferred topics, formats (e.g., AMA, workshop, guest speaker), days, and times. This co-creation process builds anticipation and ensures relevance.
- Create a Clear Value Proposition: Your event announcements must answer the question, "What's in it for me?" Clearly state the benefits, whether it's learning a new skill, getting questions answered, or networking with peers.
- Send Strategic Reminders: Don't rely on a single announcement. Send reminders a week before, a day before, and an hour before the event starts. Include the value proposition in each reminder.
- Follow Up with All Members: After the event, send a thank you to attendees with a recording or summary. To further boost your community's involvement, consider exploring strategies for creating more dynamic and engaging events. For great ideas, check out these effective interactive workshop activities that can significantly improve the experience.
Community Engagement Metrics Comparison
| Metric | Implementation Complexity 🔄 | Resource Requirements ⚡ | Expected Outcomes 📊 | Ideal Use Cases 💡 | Key Advantages ⭐ |
|---|---|---|---|---|---|
| Engagement Rate | Low – simple calculation | Low – uses existing engagement data | Measures active audience participation | Content performance analysis, social media tracking | Easy to calculate; strong content quality indicator |
| Community Growth Rate | Medium – requires tracking members | Medium – data collection over time | Indicates community size growth & momentum | Growth campaigns, resource planning | Clear growth indicator; aids forecasting |
| Response Time and Rate | Medium to High – requires monitoring responses | High – active community management | Improves member satisfaction & support quality | Customer support, active moderation | Builds trust; direct impact on retention |
| Active Member Ratio | Medium – defining 'active' is key | Medium – engagement tracking tools | Reflects genuine member involvement | Engagement quality assessment, content strategy | Offers realistic engagement insight; targets re-engagement |
| User-Generated Content Volume | Medium – tracking and moderation needed | Medium to High – content curation | Shows member investment and reduces manager content load | Content scaling, community creativity | Demonstrates authentic engagement; scalable content |
| Member Retention Rate | Medium to High – cohort analysis needed | Medium – data tracking & analysis | Indicates long-term community health & stickiness | Long-term growth monitoring, satisfaction tracking | Strong value indicator; cost-effective than acquisition |
| Sentiment Analysis Score | High – requires AI/tools or manual review | High – tech or human resources | Qualitative insights into community mood and brand perception | Brand health monitoring, reputation management | Early issue detection; guides communication strategy |
| Event Participation Rate | Medium – attendance tracking | Medium to High – event organization | Measures community engagement via events | Event planning, engagement, community bonding | Strong engagement signal; builds member loyalty |
Turning Metrics into Momentum: Your Next Steps
Moving from simply collecting data to actively shaping your community’s future is the hallmark of a truly successful creator. The eight community engagement metrics detailed in this guide, from Engagement Rate to Event Participation, are not just numbers on a dashboard; they are the vital signs of your digital space. Each metric offers a unique lens through which to view the health, vibrancy, and potential of your Telegram community.
Think of these metrics as your strategic compass. A declining Member Retention Rate isn't a failure; it's a clear signal to re-evaluate your onboarding process or content value proposition. Similarly, a low Active Member Ratio points towards a need for more interactive content, like polls or Q&A sessions, to re-engage passive members. The goal is to move beyond passive observation and into a cycle of analysis, hypothesis, and action. By understanding the story your data is telling, you can make informed decisions that resonate deeply with your audience.
Synthesising Insights for Strategic Action
The real magic happens when you start connecting the dots between different metrics. For instance, you might notice a correlation between a high Response Time and a dip in your Sentiment Analysis Score. This insight could lead you to implement a system for faster replies or set up automated responses for common queries, directly improving member satisfaction.
Consider this practical approach to get started:
- Select Your Core Metrics: Don't try to track everything at once. Choose two or three metrics from this list that align most closely with your current community goals. If you're focused on growth, start with Community Growth Rate and Active Member Ratio. If you're concentrating on building a positive atmosphere, prioritise Sentiment Analysis and User-Generated Content Volume.
- Establish a Baseline: Track your chosen metrics consistently for at least one month without making major changes. This gives you a clear baseline, a "before" picture against which you can measure the impact of your future initiatives.
- Formulate a Hypothesis: Based on your baseline data, identify one area for improvement. For example: "If we host a weekly themed discussion, we can increase our Active Member Ratio by 10% over the next month."
- Implement and Measure: Execute your plan and continue to track your core metrics. Did your change have the desired effect? This iterative process of testing and learning is the engine of sustainable community growth.
The Ultimate Goal: A Thriving, Self-Sustaining Community
Mastering your community engagement metrics is about more than just boosting numbers; it's about building a resilient, valuable, and engaging space that members are proud to be a part of. For creators running paid Telegram groups, this data-driven approach is non-negotiable. It is the most reliable path to increasing member lifetime value and ensuring your business model is sustainable. When members feel seen, heard, and valued - something only possible when you understand what engages them - they don't just stay; they become your most powerful advocates. The effort you invest today in understanding these analytics will pay dividends in the loyalty and enthusiasm of your community for years to come.
Ready to spend less time on manual admin and more time analysing the metrics that matter? MyMembers automates payment processing and member management for your paid Telegram community, freeing you to focus on creating an exceptional experience. Explore how MyMembers can streamline your community business today.